 |
 |
 |
|
||||||||||||||||||||||||
 | ||||||||||||||||||||||||
 | ||||||||||||||||||||||||
 | ||||||||||||||||||||||||
Time Course Experiments

The Olympus FluoViewTM confocal microscopes can use different scanning modes to chart time-lapse changes efficiently.
The advanced FluoViewTM confocal software makes possible multi-dimensional views of living cells and tissues that include image information in the x, y, and z dimensions as a function of time (t) and are presented in multiple colors (using two or more fluorophores). After volume processing of individual image stacks, the resulting data can be displayed as three-dimensional multicolor video sequences in real time. Note that unlike conventional widefield microscopy, all fluorochromes in multiply labeled specimens appear in register using the FluoViewTM confocal microscope. Temporal data can be collected either from time-lapse experiments conducted over extended periods or through real time image acquisition in smaller frames for short periods of time. The potential for using multi-dimensional confocal microscopy as a powerful tool in cellular biology is continuing to grow as new laser systems are developed to limit cell damage and computer processing speeds and storage capacity improves.
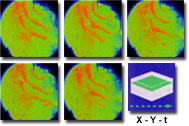
An example of time-lapse imaging with the FluoViewTM is presented in the upper figure for a calcium wave in a Xenopus oocyte stained with Calcium Green. After injection of inositol 3-triphosphate, the secondary fluorescence emission was pseudo-colored to demonstrate calcium ion waves within the cell. The image sequence was provided by Dr. Aya Muto of the Japan Science and Technology Corporation.

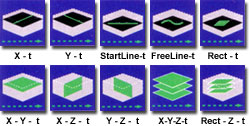
In addition to the standard lateral scan (x-y-t), free line, and diagonal line imaging modes as a function of time, the FluoViewTM software can obtain serial sections and axial scans along several dimensions at selected time intervals (see the figure on the right). This versatility in line scanning modes (linear/oblique/free line) enables flexible analysis of rapid time-lapse investigations. For high-speed observation of the specimen, the FluoViewTM is capable of scanning at the rate of four frames per second in the fast scanning mode at an image size of 512 x 512 pixels. By limiting the image size, the frame rate will be even faster. This scanning mode is suitable for living cell observation.

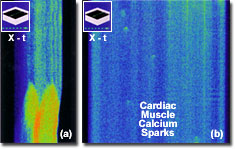
Another example of time-lapse investigations is the calcium wave and spark phenomenon observed in isolated cardiac myocytes (illustrated on the right). Both images were recorded in line scanning mode along the x dimension as a function of time. The images were provided by Dr. Sandor Gyorke of Texas Technical University. These types of experiments benefit from the high precision analysis of time-lapse changes available with the FluoViewTM software. The wide dynamic range of 12-bit images (4,096 gray levels) can reveal subtle as well as dramatic changes in fluorescence. By employing rectangle, circle, or free-line area scans, the operator can designate several regions of interest and observe or measure them simultaneously during or following time-lapse observations through the display of intensity versus time graphs. Event markers may also be inserted during the experiment to correlate changes in experimental conditions.
